- YX Insights
- Pages
- YX Insights Premium
Unlock Smarter Trading Decisions with YX Insights
YX Insights delivers actionable, daily market analysis powered by advanced quantitative models, macro-driven insights, and technical analysis. Our service empowers you with clarity, conviction, and a disciplined approach to trading and investing.
(Please note: YX Insights is not for everyone. It's tailored specifically for serious investors who prioritise data-driven decisions over emotional impulses. Our subscribers value the objectivity of quantitative signals over gut instincts and possess the discipline to withstand market volatility. With YX Insights, subscribers gain the confidence to resist the natural tendency to prematurely cut winners or hold onto unrealised losses.)
What We Cover:
We focus on a tightly curated set of core instruments:
Macro & Rates: US Treasuries (TLT), S&P 500 (SPY), Nasdaq 100 (QQQ), Gold (GLD), Oil (USO)
Crypto: Bitcoin (BTC)
Large Cap Equities: Apple (AAPL), Amazon (AMZN), Alphabet (GOOGL), Meta (META), Microsoft (MSFT), Nvidia (NVDA), Tesla (TSLA), Palantir (PLTR)
What You'll Receive:
Daily Systematic Signals: Clear risk-on/ risk-off signals for SPY, QQQ, BTC, TLT, AAPL, AMZN, GOOGL, META, MSFT, NVDA, TSLA, and PLTR from proprietary machine-learning models
Macro and Technical Insights: Unique breakdowns of global macro events, market liquidity conditions, and technical setups.
Comprehensive Asset Coverage: Daily detailed analyses across equities, bonds, crypto, precious metals, and major market indices.
(Backtesting results of the Systematic Signals are available at the bottom of the page)
Why Choose YX Insights?
Quantitative Edge: Proprietary machine learning models generate long-only trade signals to maximize risk-adjusted returns (Sharpe Ratio).
Macro Clarity: We present clear yet insightful explanations of complex macroeconomic developments and their market implications.
Multi-model Approach: We deploy a winning combination of market fundamentals, macro drivers, valuation, and technical analyses in addition to the machine-learning models.
About Yimin:
Yimin brings deep experience in global macro, interest rate markets, and liquidity analysis. His professional background includes working as a market-maker in short-term interest rates and FX swaps at a global investment bank, complemented by his Chartered Accountant qualification. Since 2022, Yimin has provided dedicated commentary on FOMC decisions and macro developments for Seeking Alpha News.
Pricing and Subscription:
$599/month or $4999/year (30% discount)
Our prices increase periodically for new subscribers, but never for existing members - lock in your rate today.
Subscriber Testimonials
“Macro coverage around rates, liquidity, and money supply is where YX Insights truly stands out.”
“Yimin has a unique ability to take a macro subject Bonds and drill down to the components that lead to price movements”
“I am really wowed by your service. Thanks so much.”
“A very easy to digest format and habit-forming since it comes every market day, and not to mention the successful systematic signals.”
“YX Insights clearly demonstrated how global liquidity impacts stocks and Bitcoin. This was genuinely eye-opening for me.”
“The TLT Signal is very interesting (and I will be following it from now on with a pool of capital) and am excited about the Mag 7 with the way you are outlining potential chart paths, etc and the opportunity that brings for actionable trade set-ups.”
“The daily macro updates help me stay calm and focused, particularly during turbulent markets.”
“YX Insights’ macro research is something I rely on heavily.”
“The perfect format for a morning read to prep for my day.”
“YX Insights provides unique perspectives on Mag 7 stocks and Crypto that I haven’t found elsewhere. The trade setups with clear entry and exit points are especially helpful.”
“The educational insights into macroeconomics and detailed charts are highly informative and helpful. This service has significantly improved my understanding of the market.”
“I appreciate that YX Insights delivers high-quality ideas suited perfectly to my investment timeframe of 1 to 12 months.”
Appendix: YXI Signals Backtests
Backtest Results:
(These results are based on historical data and may not predict future performance.)
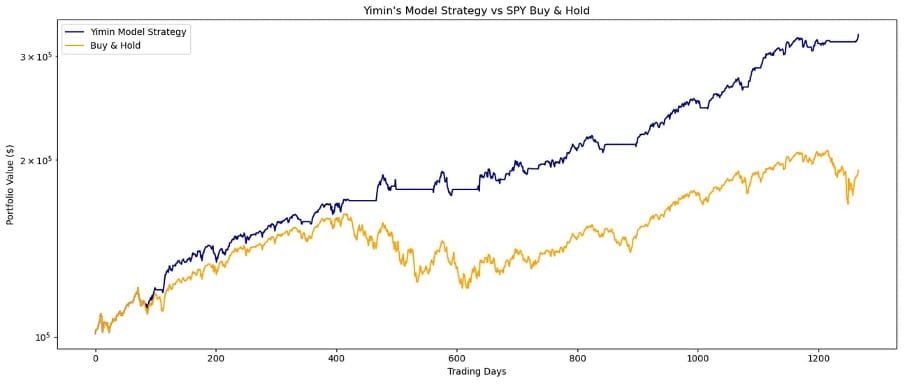
SPY
Strategy Sharpe Ratio: 1.97
Strategy Maximum Drawdown: -9.06%
Buy & Hold Sharpe Ratio: 0.81
Buy & Hold Maximum Drawdown: -25.36%
Note the y-axis below is in log scale.
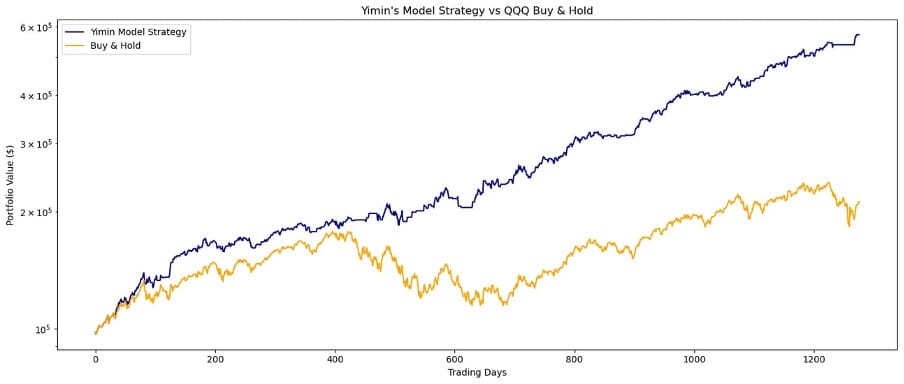
QQQ
Strategy Sharpe Ratio: 2.19
Strategy Maximum Drawdown: -11.84%
Buy & Hold Sharpe Ratio: 0.77
Buy & Hold Maximum Drawdown: -35.62%
Note the y-axis below is in log scale.
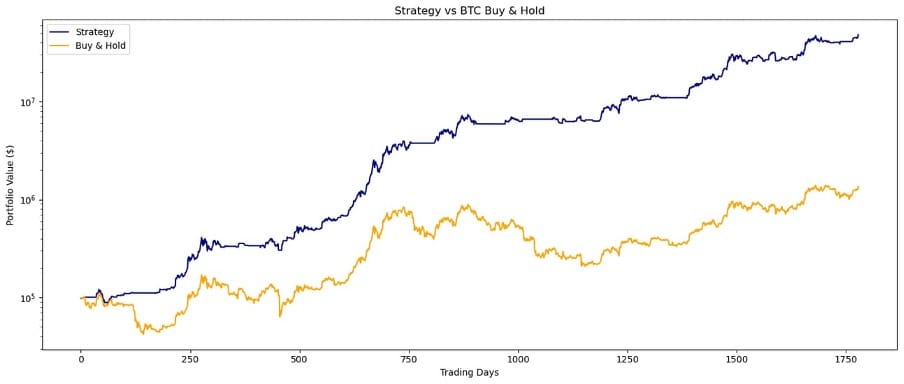
BTC
Strategy Sharpe Ratio: 2.05
Strategy Maximum Drawdown: -27.71%
BTC Buy & Hold Sharpe Ratio: 0.90
BTC Buy & Hold Maximum Drawdown: -76.66%
Note the y-axis below is in log scale.
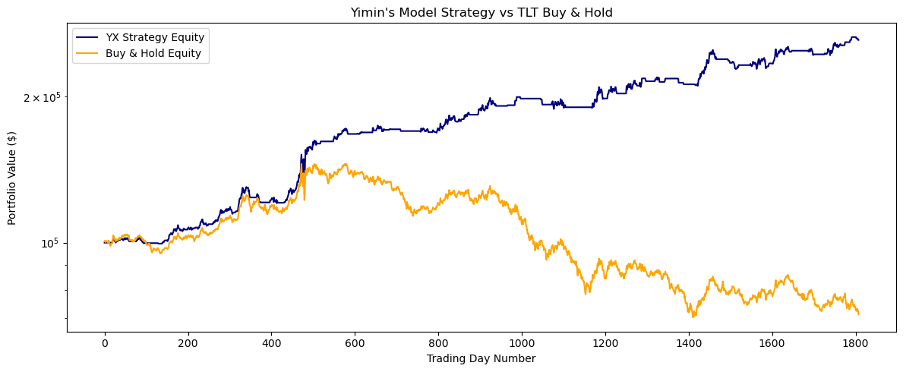
TLT
Strategy Sharpe Ratio: 1.27
Strategy Maximum Drawdown: -8.68%
Buy & Hold Sharpe Ratio: -0.18
Buy & Hold Maximum Drawdown: -51.76%
Note the y-axis below is in log scale.
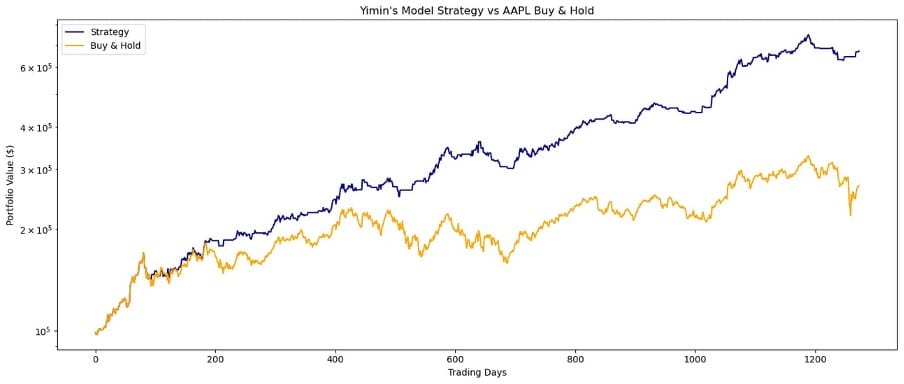
AAPL
Strategy Sharpe Ratio: 1.86
Strategy Maximum Drawdown: -16.53%
Buy & Hold Sharpe Ratio: 0.77
Buy & Hold Maximum Drawdown: -33.43%
Note the y-axis below is in log scale.
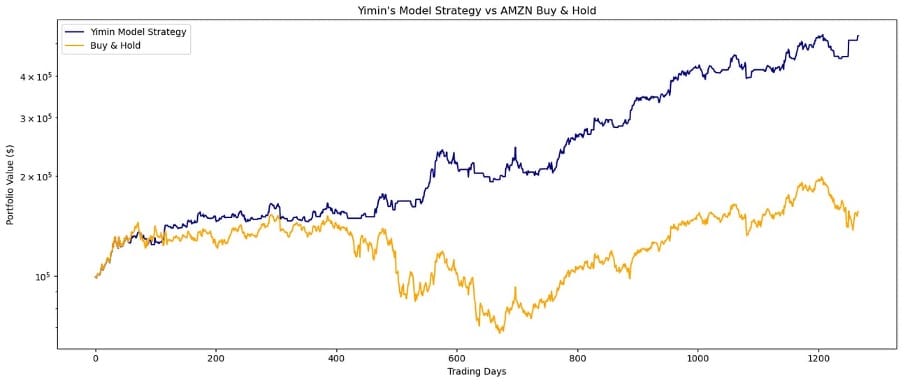
AMZN
Strategy Sharpe Ratio: 1.47
Strategy Maximum Drawdown: -19.86%
Buy & Hold Sharpe Ratio: 0.44
Buy & Hold Maximum Drawdown: -56.15%
Note the y-axis below is in log scale.
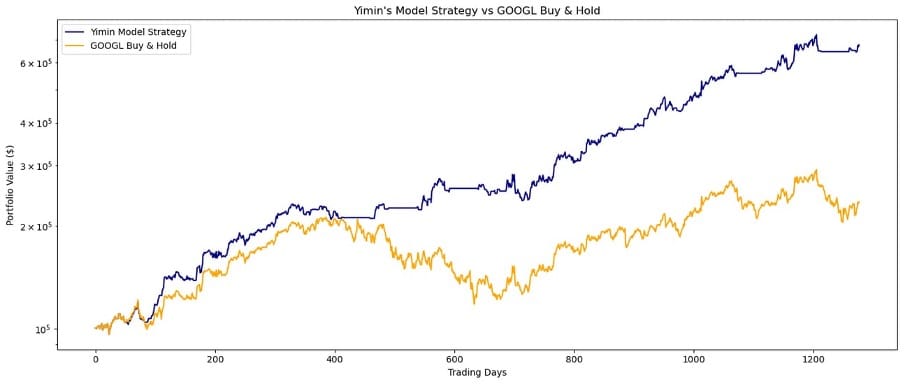
GOOGL
Strategy Sharpe Ratio: 1.79
Strategy Maximum Drawdown: -16.07%
Buy & Hold Sharpe Ratio: 0.70
Buy & Hold Maximum Drawdown: -44.32%
Note the y-axis below is in log scale.
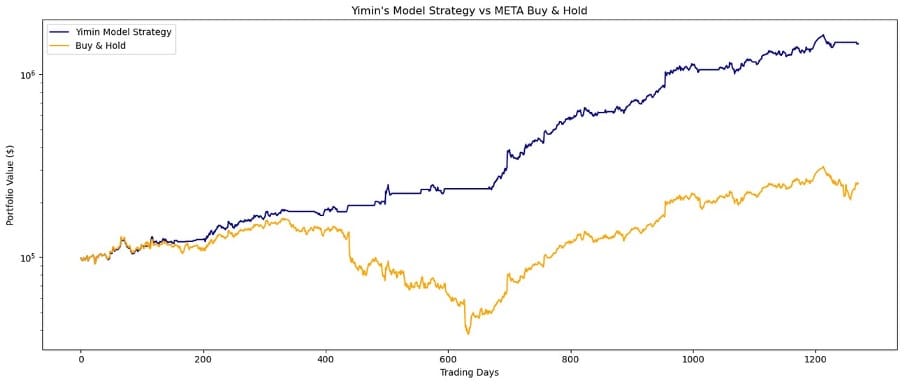
META
Strategy Sharpe Ratio: 1.90
Strategy Maximum Drawdown: -18.35%
Buy & Hold Sharpe Ratio: 0.65
Buy & Hold Maximum Drawdown: -76.74%
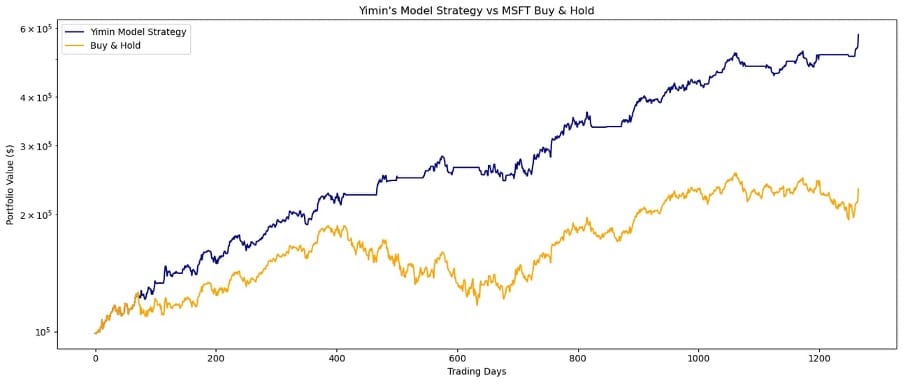
MSFT
Strategy Sharpe Ratio: 1.90
Strategy Maximum Drawdown: -13.49%
Buy & Hold Sharpe Ratio: 0.78
Buy & Hold Maximum Drawdown: -37.56%
Note the y-axis below is in log scale.
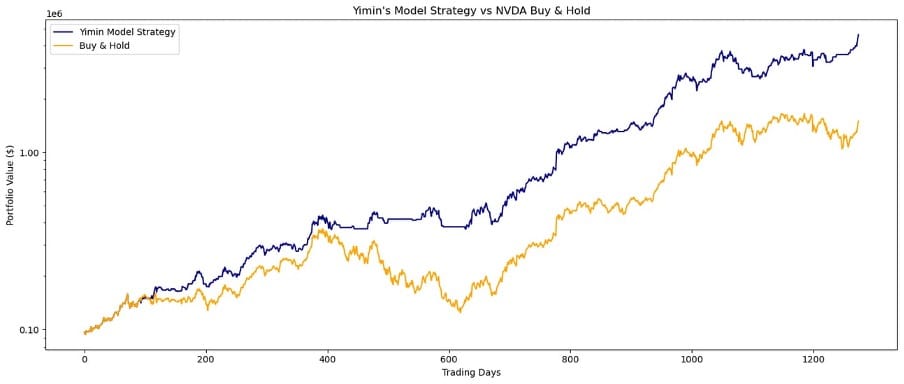
NVDA
Strategy Sharpe Ratio: 2.04
Strategy Maximum Drawdown: -30.50%
Buy & Hold Sharpe Ratio: 1.29
Buy & Hold Maximum Drawdown: -66.36%
Note the y-axis below is in log scale to offer a clearer comparison between the two strategies
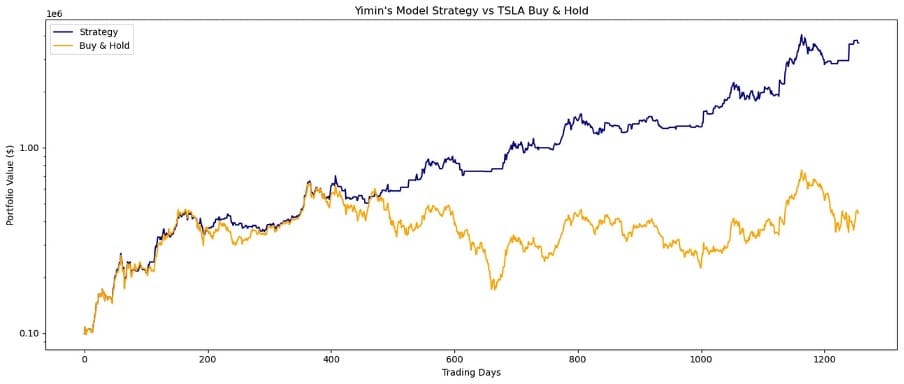
TSLA
Strategy Sharpe Ratio: 1.70
Strategy Maximum Drawdown: -33.74%
Buy & Hold Sharpe Ratio: 0.78
Buy & Hold Maximum Drawdown: -73.63%
Note the y-axis below is in log scale to offer a clearer comparison between the two strategies.
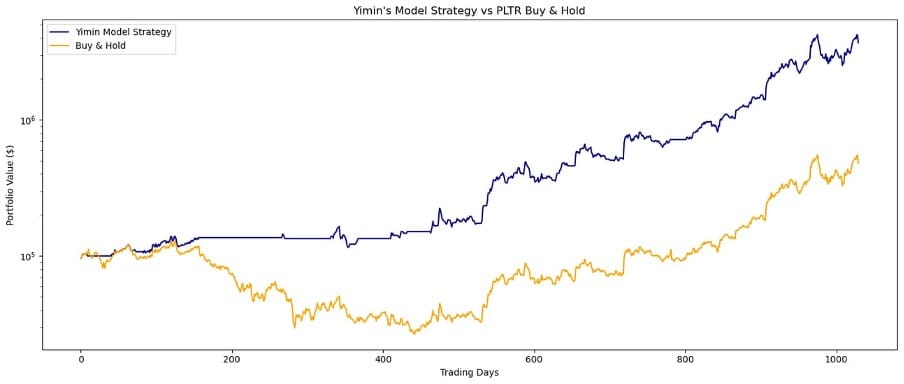
PLTR
Strategy Sharpe Ratio: 1.88
Strategy Maximum Drawdown: -40.61%
Buy & Hold Sharpe Ratio: 0.91
Buy & Hold Maximum Drawdown: -79.14%
Note the y-axis below is in log scale to offer a clearer comparison between the two strategies
Yimin Xu - 30 May 2025.